Simulation SubModule
It is a sub-module that allows simulating the gas volume and gas velocity along the gas line with the data available or directly with the data to be determined by the user.
1 What is?
This Submodule lists all hydraulic simulations. Also, Hydraulic calculation are made in this submodule.
2 About whom?
Since the system is parametric, it is in a structure that can be changed by the authorized or the system administrator. But basically, this section has been developed for the use of:
This submodule is used by dispatchers.
3 Main Features
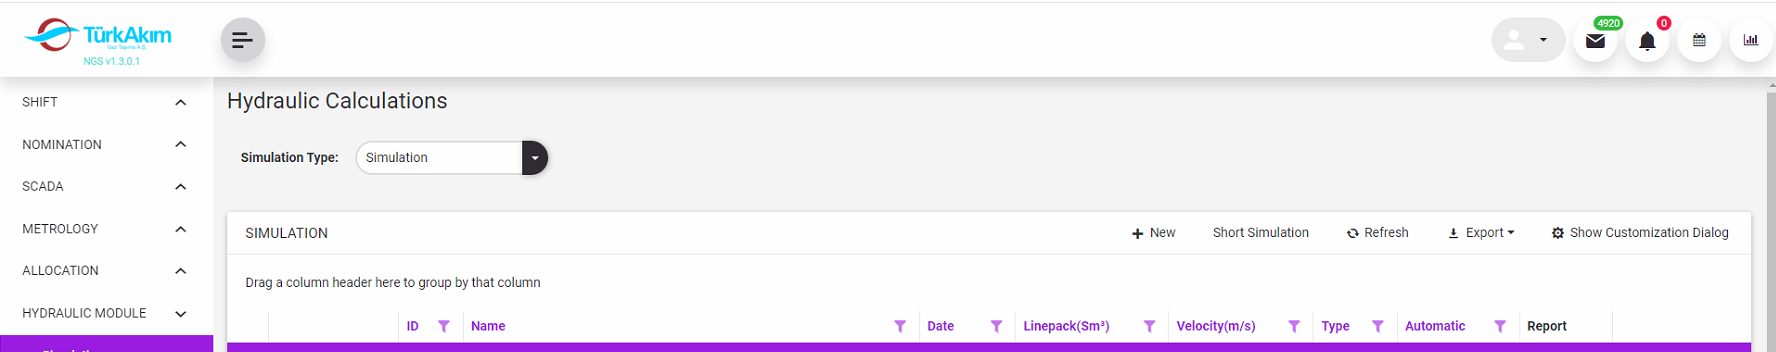
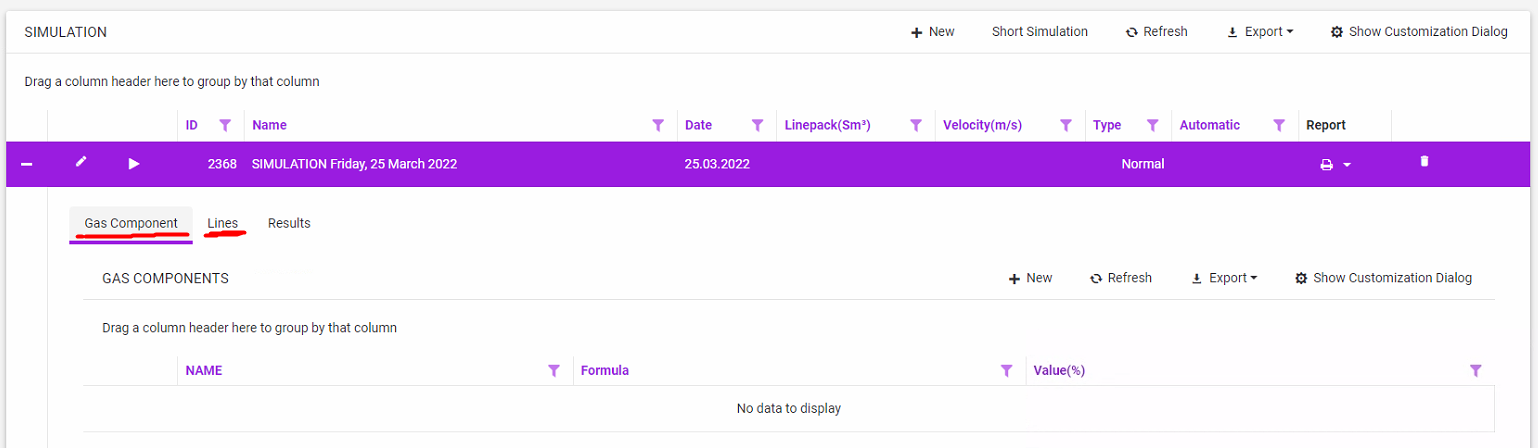
In this module, Hydraulic calculation are made, and the results are listed and reported.
List can be filtered by Simulation type.
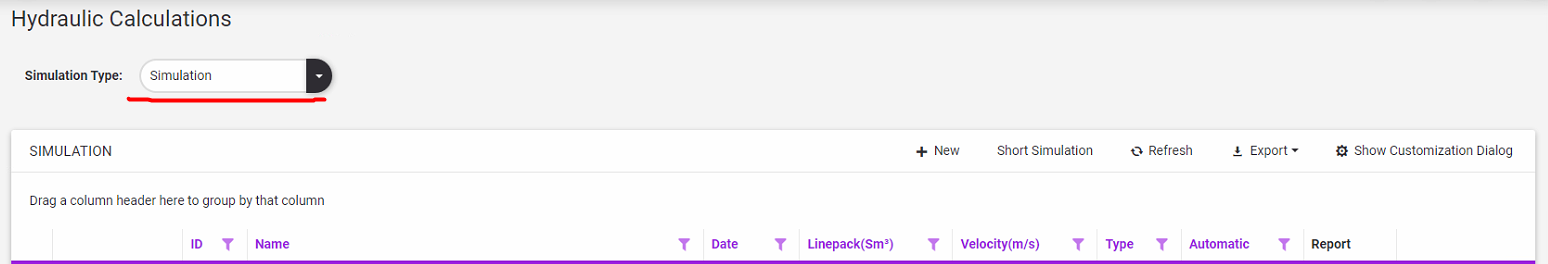
By clicking "New" button, new simulation project can be created.
![]()
After clicking "New" button, New Project popup window is opened.
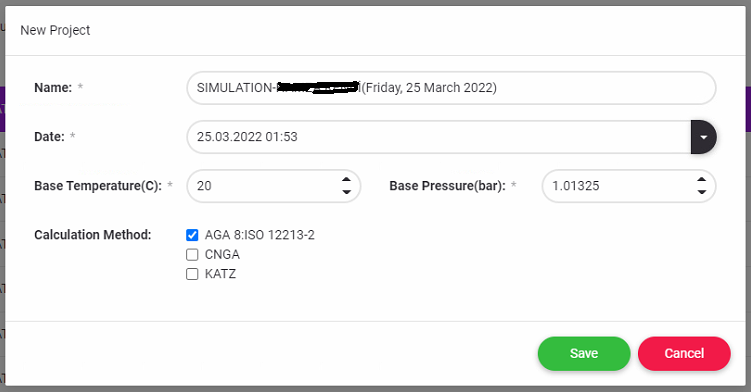
Project Name is automatically set by system. User can change the project name. Date is set by system.
There are 3 calculation methods. AGA, CNGA and KATZ.
User can choose Calculation Methods.
By clicking Save Button, New project are created and listed.
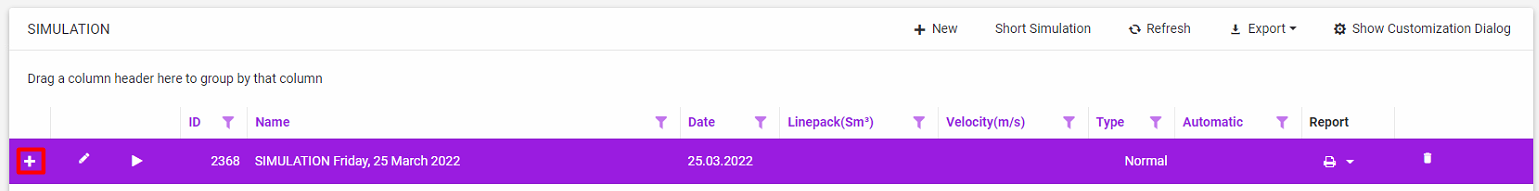
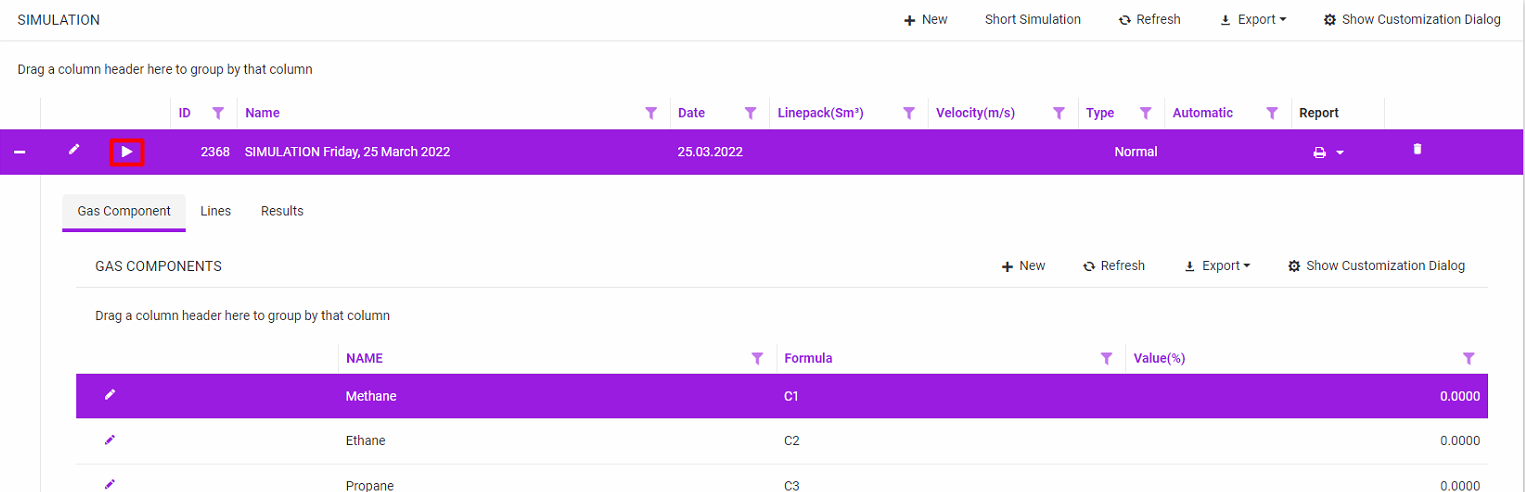
By pressing “+” button, Gas Components and Lines properties can be add the project.
By clicking "New" button in Gas Component part, input values popup window is opened.
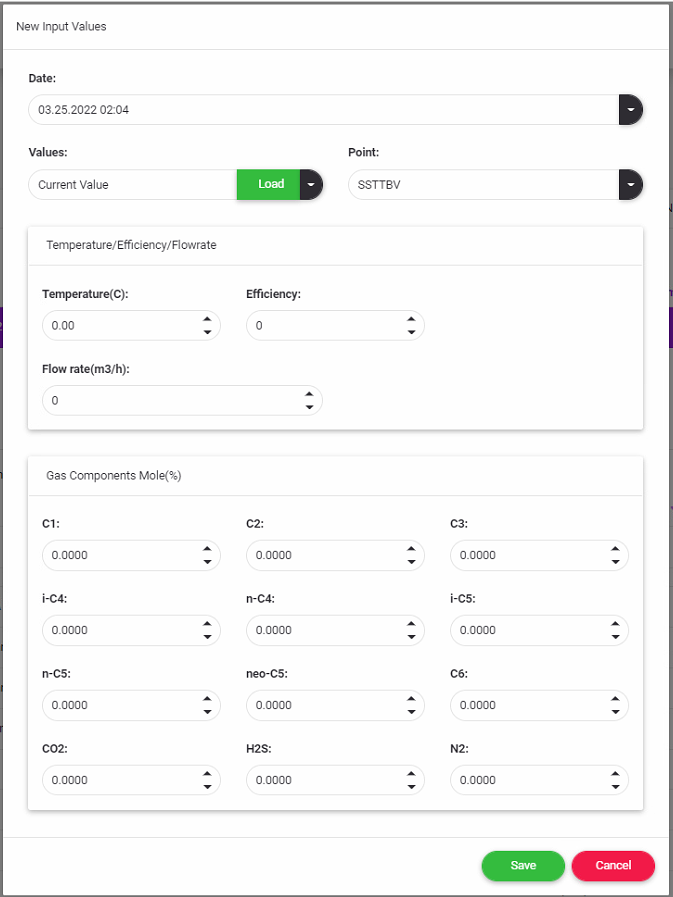
User can select date, point and values. These values taken from scada according to users choices. And also User can set the values manually.
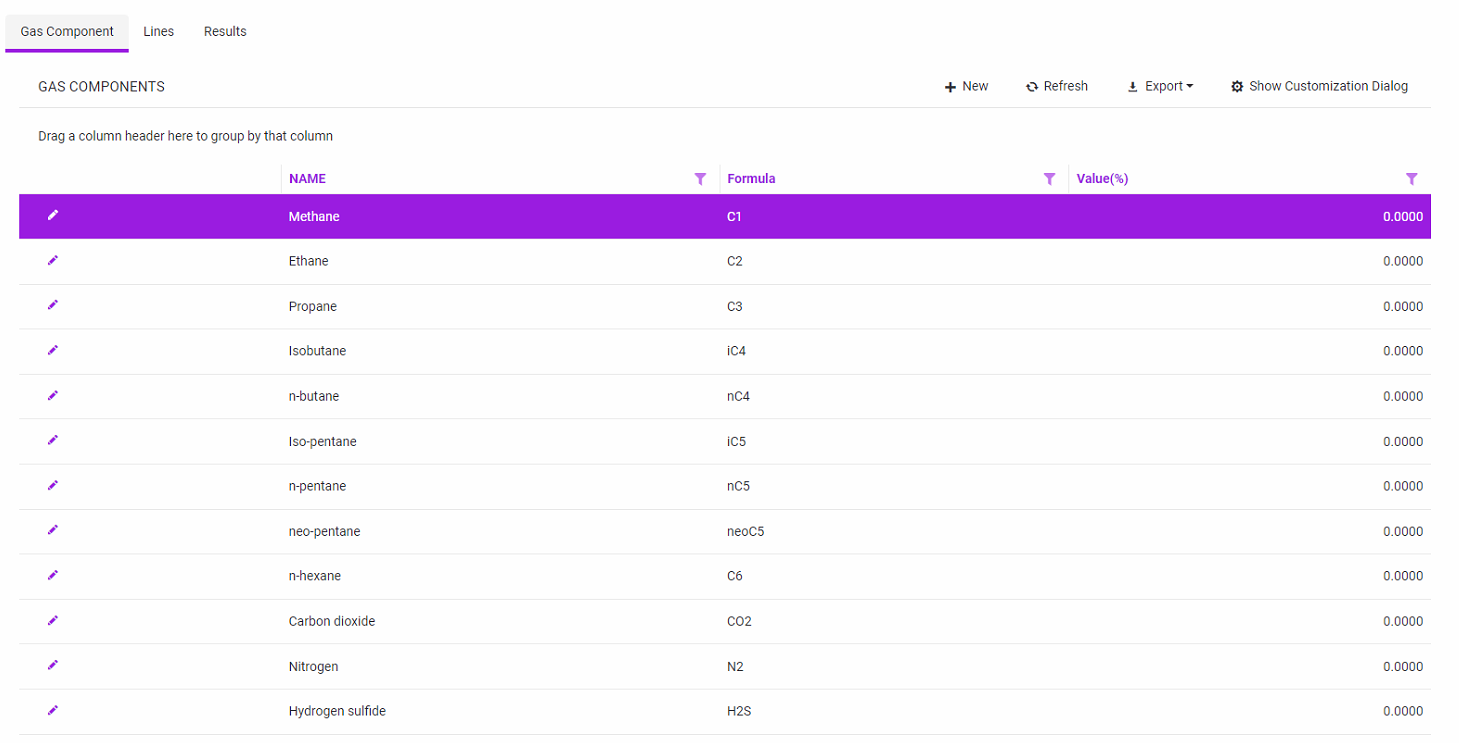
By pressing "Save" button Gas Components values are saved for the project and listed.
By clicking "New" button in Lines part, New Line popup window is opened.
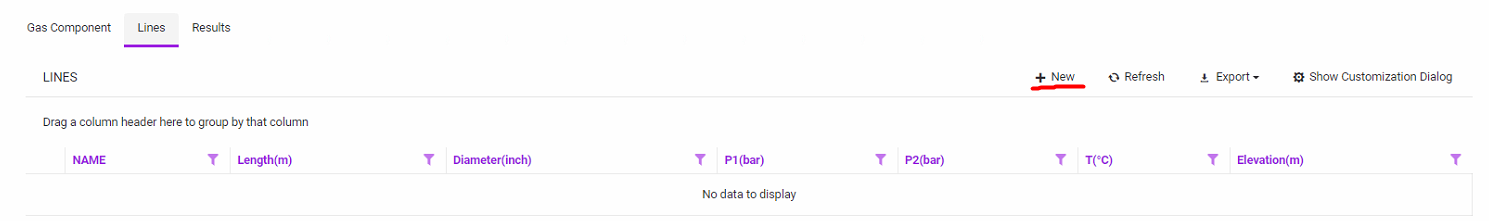
Pressing "Add" button, line properties can be added.
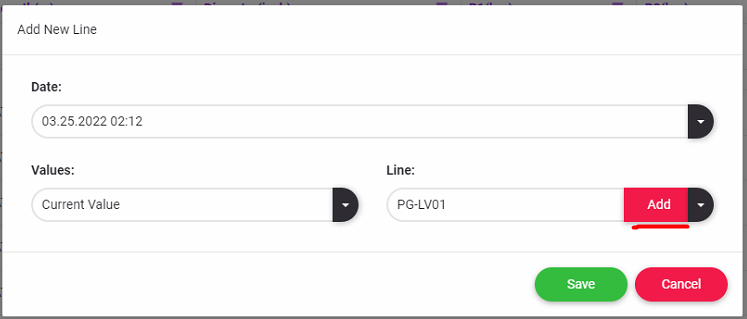
After pressing "Add" button values are taken from Scada according to users choices.
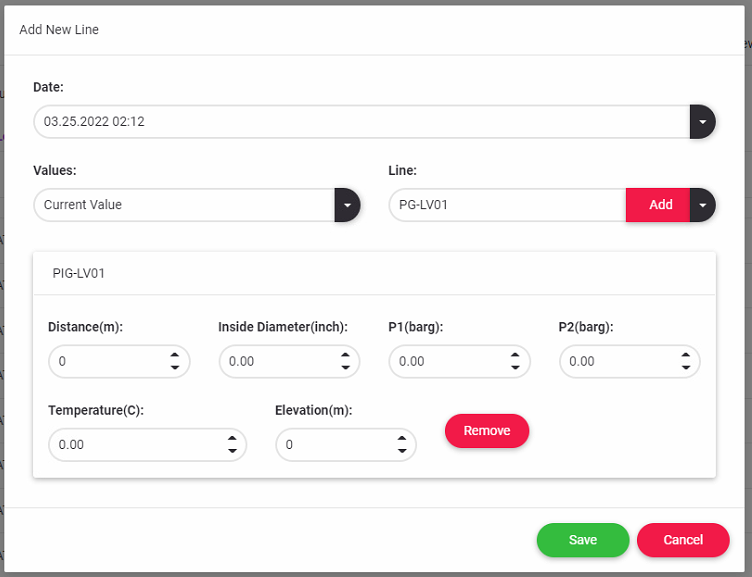
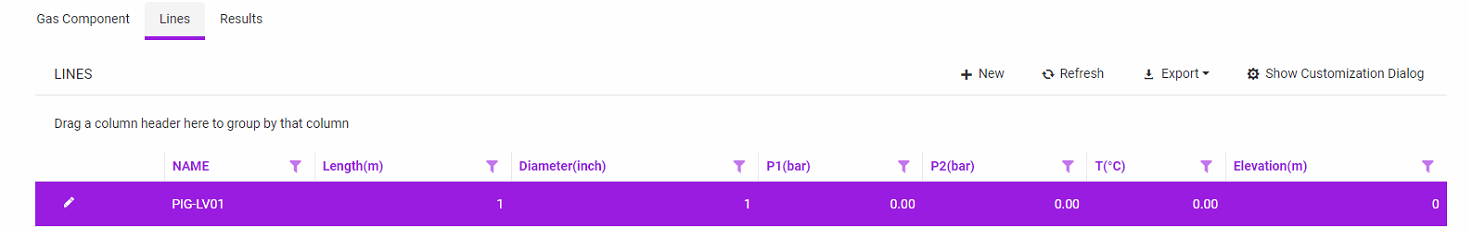
By pressing "Save" button Line properties are saved for the project and listed.
After Gas Component Values and Line properties are set, Calculation can be made.
Pressing Calculate Compressibility Factor Calculation popup window is opened.
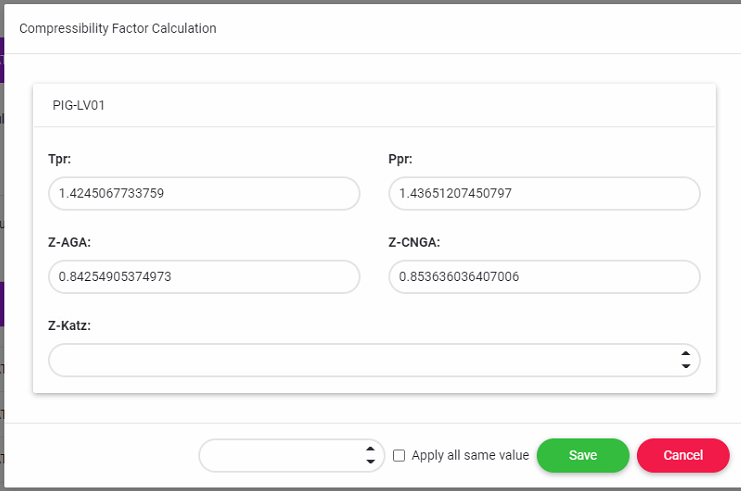
The user can set the Z-Katz value by using the calculated Tpr and Ppr values on the Standing and Katz Chart.
If the user sets the Z-Katz value, the system calculates the linepack value according to the KATZ method in addition to the AGA and CNGA methods.
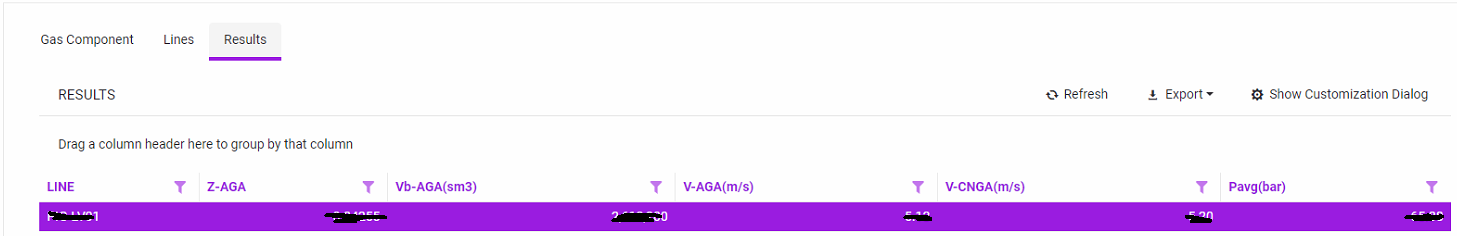
Results are listed in Results part.
Simulation can be reported by clicking Report button.

In Report, all input values and output values are shown separately for each line in details. Also includes velocity diagram, pressure diagram and linepack diagram.
