Main Dashboard
0 Dashboard Settings
When you click on the "Dashboard" link in the upper right part of the "Default Page", the settings will open.
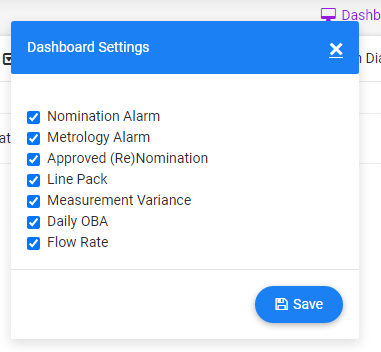
It is activated or deactivated by selecting the icon next to the Dasboard to be displayed here. The selections made with the Save button are updated on the screen.
1 Nomination Alarms
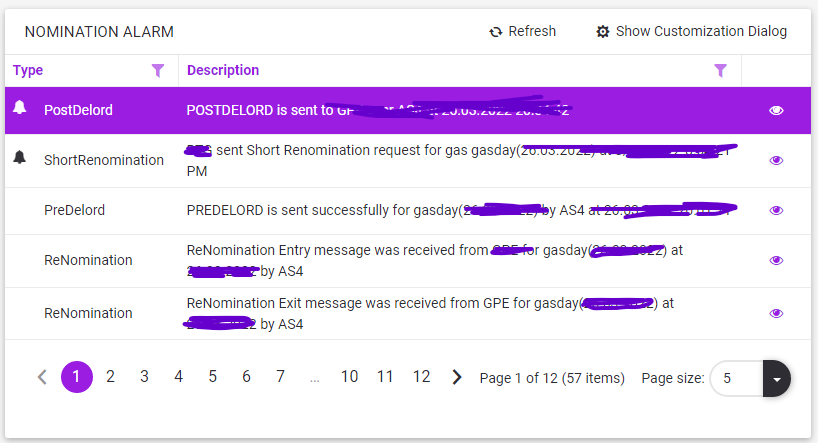
This table (if any) is a section where alarms related to the Nomination process are displayed by the system.
See for details on table usage Table Structure (Grid) and for details on Alarms see Alarm (Nomination).
2 Metrology Alarms
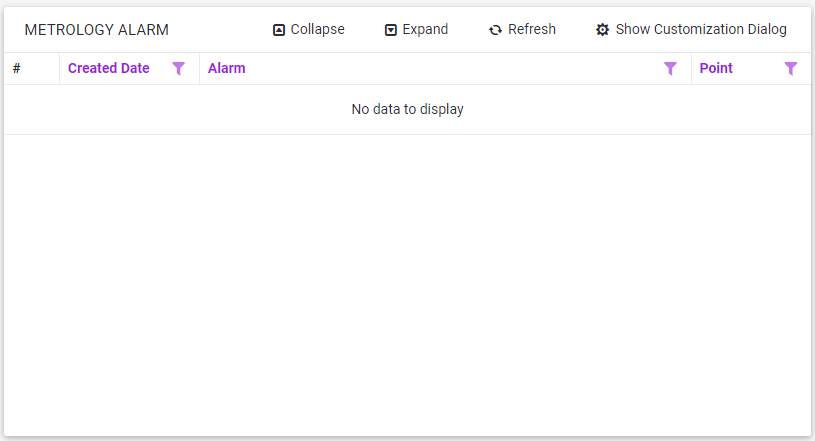
This table (if any) is a section where alarms related to the SCADA-METROLOGY data are displayed by the system.
See for details on table usage Table Structure (Grid) and for details on Alarms see Received Alarms.
3 Approved (Re) Nominations

The last (Approved) Nomination or Renomination value valid for the System Gas Day is shown in Sm³ or kWh.
4 Line Pack
The daily Line Pack values calculated for the last 15 days are displayed as a bar graph.
5 Measurement Variance
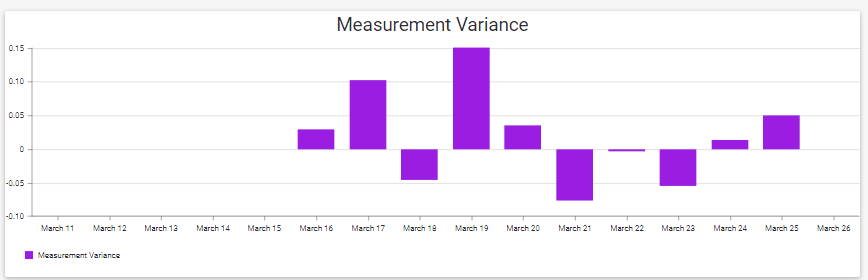
The daily Measurement Variance calculated for the last 15 days is displayed as a bar graph. (For variance zero, the Y-axis is considered Zero.)
6 Daily Oba
The daily OBA values (Sm³ unit) calculated for the last 15 days are displayed as a graph. (Daily Oba)
7 Entry/Exit Flow Rate
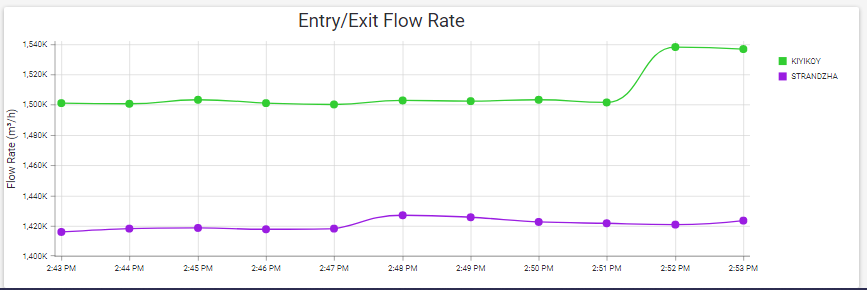
It is the graph showing the flow rate (m³/h unit) at the Entry and Exit points for the last 10 minutes in the system.